
01
Wind
Direction and speed shape the projected movement of fire.
Pantau Api / Fire-spread intelligence
Perkirakan arah rambatan api dalam 3, 6, dan 12 jam.
Move from the location of a hotspot to a modelled view of where fire could spread next.
Pantau Api connects satellite detections with environmental conditions to support early warning, situational awareness and response planning for forest and land fires.
Three time horizons; high, medium and low modelled risk can be assessed within each. Forecasts depend on the inputs and assumptions used.
The problem
For teams working in peatland landscapes, knowing where heat has been detected is only part of the picture. They also need to consider where a fire may travel as conditions change.
The product's South Sumatra case studies focus on Ogan Komering Ilir and Musi Banyuasin. Its model brings wind, soil moisture, slope and land cover into a common estimate of potential spread.
Industrial activity can also create persistent heat signatures. Distinguishing these signals helps teams review alerts with more context, while keeping possible fire activity under scrutiny.
Inside the application
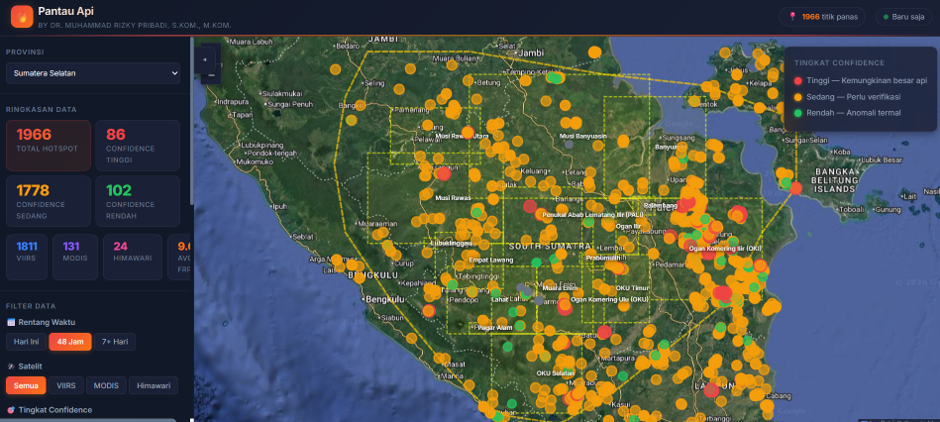
Review hotspots on a map, filter the observation window and satellite source, and examine detection-confidence categories before exploring the modelled outlook.
The modelling perspective
A deterministic vector model estimates direction and rate of spread. Its lightweight calculation is designed to produce rapid results using the available input data.
01
Direction and speed shape the projected movement of fire.
02
Ground conditions inform how readily the landscape may support spread.
03
Terrain contributes to the model's estimate of the rate of spread.
04
Peatland, scrub, oil palm and open land provide different landscape contexts.
Hotspot + environmental inputs → direction and rate of spread → projected zones at 3, 6 and 12 hours.
Calculation speed and data freshness are different: a fast model still depends on when satellite observations and environmental inputs were collected.
Core capabilities
01
Use NASA FIRMS VIIRS and MODIS detections as the starting point for analysis. A thermal detection identifies a heat anomaly; it does not, by itself, establish the extent of a fire.
02
A lightweight mathematical vector model combines wind direction with a rate of spread informed by four environmental factors. It is designed for rapid calculation on a server or in a browser.
03
Project direction and extent at T+3, T+6 and T+12 hours. High, medium and low modelled risk zones provide a spatial view of potential exposure at each horizon.
04
Multi-point spread curves present the projected pattern more naturally on the map, helping users read the direction and reach of the modelled zones.
05
The described filter excludes recurring detections present for at least 30 days within an approximately 500-metre radius from alerts. This is a screening rule for potential industrial sources, not confirmation that an area is free of fire.
06
The validation approach compares modelled areas with satellite reference data using Intersection over Union (IoU) and Dice. The stated target is IoU ≥ 0.70; achieved results have not been supplied for publication.
Who it supports
Review hotspot signals and potential exposure alongside field reports to inform response planning.
Build a shared situational picture across environmental monitoring and preparedness responsibilities.
Understand modelled exposure around managed landscapes and support coordination with authorized response teams.
Examine model assumptions, compare forecast geometry with reference observations and document validation findings.
Illustrative use cases
A new detection appears in OKI. An analyst examines the six-hour scenario, checks its inputs and considers possible exposure alongside local observations.
A detection repeatedly appears near an industrial site. The team reviews the persistence filter and source context before interpreting its alert status.
Researchers compare predicted areas with satellite reference observations, report IoU and Dice, and document where the model performs well or needs refinement.
Validation & interpretation
IoU ≥ 0.70 is the stated validation target, not a published performance result.
A useful evaluation should identify the reference data, study area, observation period and performance at each forecast horizon. Dice provides a complementary measure of spatial overlap.
Detection confidence, modelled risk and validation accuracy describe different things. A high-confidence thermal detection does not automatically establish a high-risk spread zone.
Use the outlook alongside current weather, field verification and official incident procedures. Deployment, evacuation and safety decisions remain with the responsible authorities and trained teams; a modelled low-risk area is not a safety guarantee.
Satellite-data context: NASA FIRMS identifies active fire and thermal anomalies, including non-fire heat sources. See NASA's active-fire data caveats. These references describe the input data, not independent validation of Pantau Api.
Explore Pantau Api
Discuss the study area, available environmental inputs, forecast views and validation evidence in a product walkthrough.